7.3. Plotting component maps
Component maps are calculated by integrating the spectroscopic image over user-selected spectral ROIs, resulting in spatial maps that show the spatial distribution of each component. They can be visualized with the following command:
plot_comp_maps.sh -spect_imfile spect_imfile_name -spectmaskfile spectmaskfile_name -outprefix outprefix_name
plot_comp_maps('spect_imfile','___','spectmaskfile','___','outprefix','___')
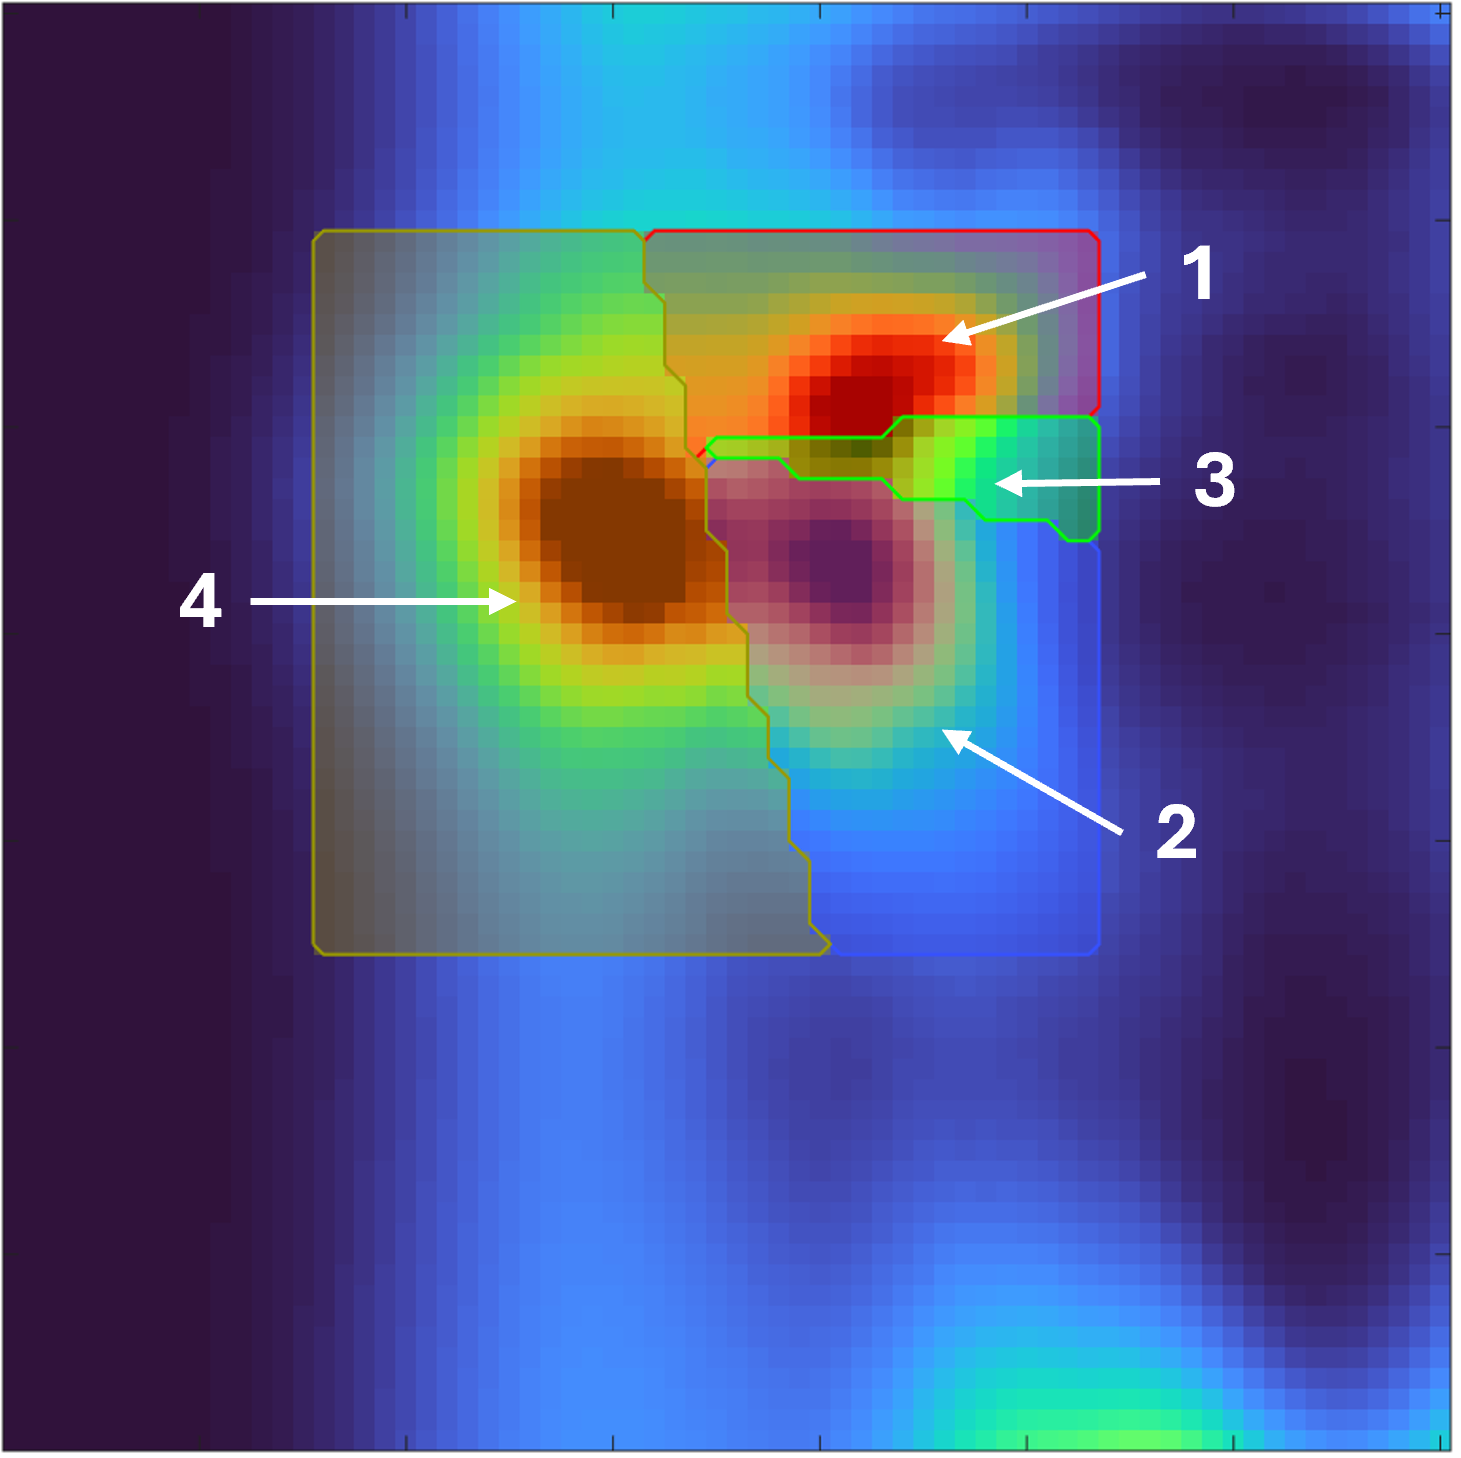
Example spectral ROIs.
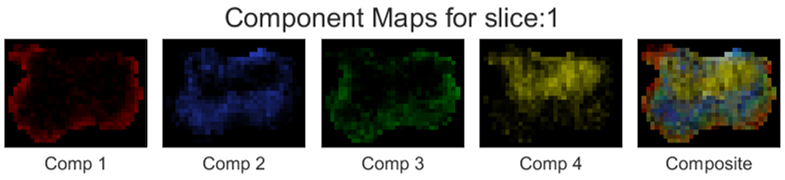
Example component maps.
When using optional arguments, the following syntax should be used:
plot_comp_maps.sh -spect_imfile spect_imfile_name -spectmaskfile spectmaskfile -outprefix outprefix_name -color color_name -weights weights_values -cbar tf -file_types file_types_name
plot_comp_maps('spect_imfile','___','spectmaskfile','___','outprefix','___','color','___','weights','___','cbar','___','file_types','___')
7.3.1. Required inputs
spect_imfile::
The spectroscopic image to be visualized. The spectroscopic image must be in the
spectImagefileformat (e.g., as generated through DRSuite’s spectroscopic image estimation tool) as described here.specMaskfile:
A set of binary spectral ROI masks used to calculate component maps. This must be in the
spectmaskfileformat as described here, with the same spectral dimensions as the spectroscopic image.outprefix:
A string specifying the filename prefix to use for the saved output images.
7.3.2. Optional Inputs
file_types: char | string | cellstr | string array
Output formats (case-insensitive). Allowed:
fig,m,eps,epsc,ai,pdf,bmp,jpg,jpeg,png,tif,tiff. Default:"png". Invalid entries are ignored.color: char | string
Path to
.matfile with variablecolorof size3×Nc(values are RGB in [0,1], columns correspond to components). If omitted, a built-in 13-color set is used. See here for more information.weights: numeric vector
Length
Nc. Visualization weight for each component (affects color scaling). Default: all ones.cbar: numeric (0/1)
Show colorbar for individual component maps. Default: 0 (no colorbar).
7.3.3. Outputs
This function writes two files:
Figures:
<outprefix>_<slice>.<ext>for each requested extension.Data file:
<outprefix>.matcontaining:data % Nc × Nx × Ny × Nz numeric array (component maps) resolution % [dx dy dz] in physical units transform % 4×4 (as provided in input spectfile) spatial_dim % [Nx Ny] or [Nx Ny Nz]
Note
spectral_dimmust have length 1 or 2. The function errors iflength(spectral_dim) >= 3.The built-in colormap supports up to 13 components. Provide a custom color file if
Nc > 13.